How Calculating Baseline Sales Can Determine the Success of Promotions

Understanding the baseline
Many of us have been in the same situation, contemplating whether to stick with the previous year’s plans, to be more aggressive with pricing, invest in bigger and better store displays or to do something completely different. Without understanding the baseline sales during promotions, you can’t really measure the effectiveness of a promotion or its profitability and making adjustments to promotional plan is based on gut feelings and sophisticated guesses. The cornerstone of data-driven trade promotion planning is going beyond estimating promotional sales alone when calculating promotional success. Those brands that are committed to data-driven decision-making and put emphasis on reliable baseline calculations stay ahead of the competition. The biggest challenge related to trade promotions is already tackled and they know exactly how different activations impact the company’s bottom line.
One of our previous blog posts discussed six common pitfalls regarding promotion impact analysis and how to avoid them. If you missed that post, we recommend reading it as well (the link is available at the end of this article). However, the next few chapters will go deeper into the analytics, understanding the baseline sales and calculating true incremental sales.
We present three different methods, which all will help you to analyze your previous promotions. Depending on how much time and effort you can invest and how experienced you are with data crunching, we will advise you on how to go from calculating the average to deploying artificial intelligence.
Depending on how much time and effort you can invest and how experienced you are with data crunching, we will advise you on how to go from calculating the average to deploying artificial intelligence.
Understanding your baseline sales is the starting point for everything. How much would you have sold if the executed campaign would have never happened? These methods are explained to give you a rough understanding of the effort required. The more complex the case or scattered the data, the longer it can take. The one-hour method can take days or the one-month method could be the biggest project of the year.
- The one-day method: Reference period
- The one-week method: Linear regression
- The one-month method: Non-linear machine learning
The one-day method: Reference period
The simplest method for calculating the baseline is to take sales data from a few previous weeks before the promotion period and calculate the weekly average. When you then compare promotion sales to this calculated weekly average, you will find out a relation that is called campaign lift.
.png)
In this example we are using weekly sales data. If your campaigns do not start in the beginning of the week and/or last full weeks, you should use daily sales data instead of weekly data.

This simple method works well when applied to products that have stable demand around the year. In case seasonality is an attribute to your products, you should consider calculating the average using the same time period of the previous year. However, the most important thing to keep in mind is that the reference period you choose can not contain any promotions, otherwise the campaign lift will be underestimated.

When to apply?
This is a rather simple method that could be applied even to a large number of promotions. The prerequisite for this method is to have all the information regarding your previous promotions and that they are filtered out. This method gives you direction, but not the highest accuracy.
The one-week method: Linear regression
If seasonality is an attribute of your products or you have succeeded in growing your sales steadily, you will gain a better understanding of the campaign lift by using a slightly more sophisticated model that considers trends. You can use linear regression and take the effect into account to your baseline sales estimates. You get started with this also using Excel.
Below you find an example figure, we are utilizing similar values from the one-hour method but applied a weekly growth rate of 2%. The growing trend can be clearly seen from the figure.
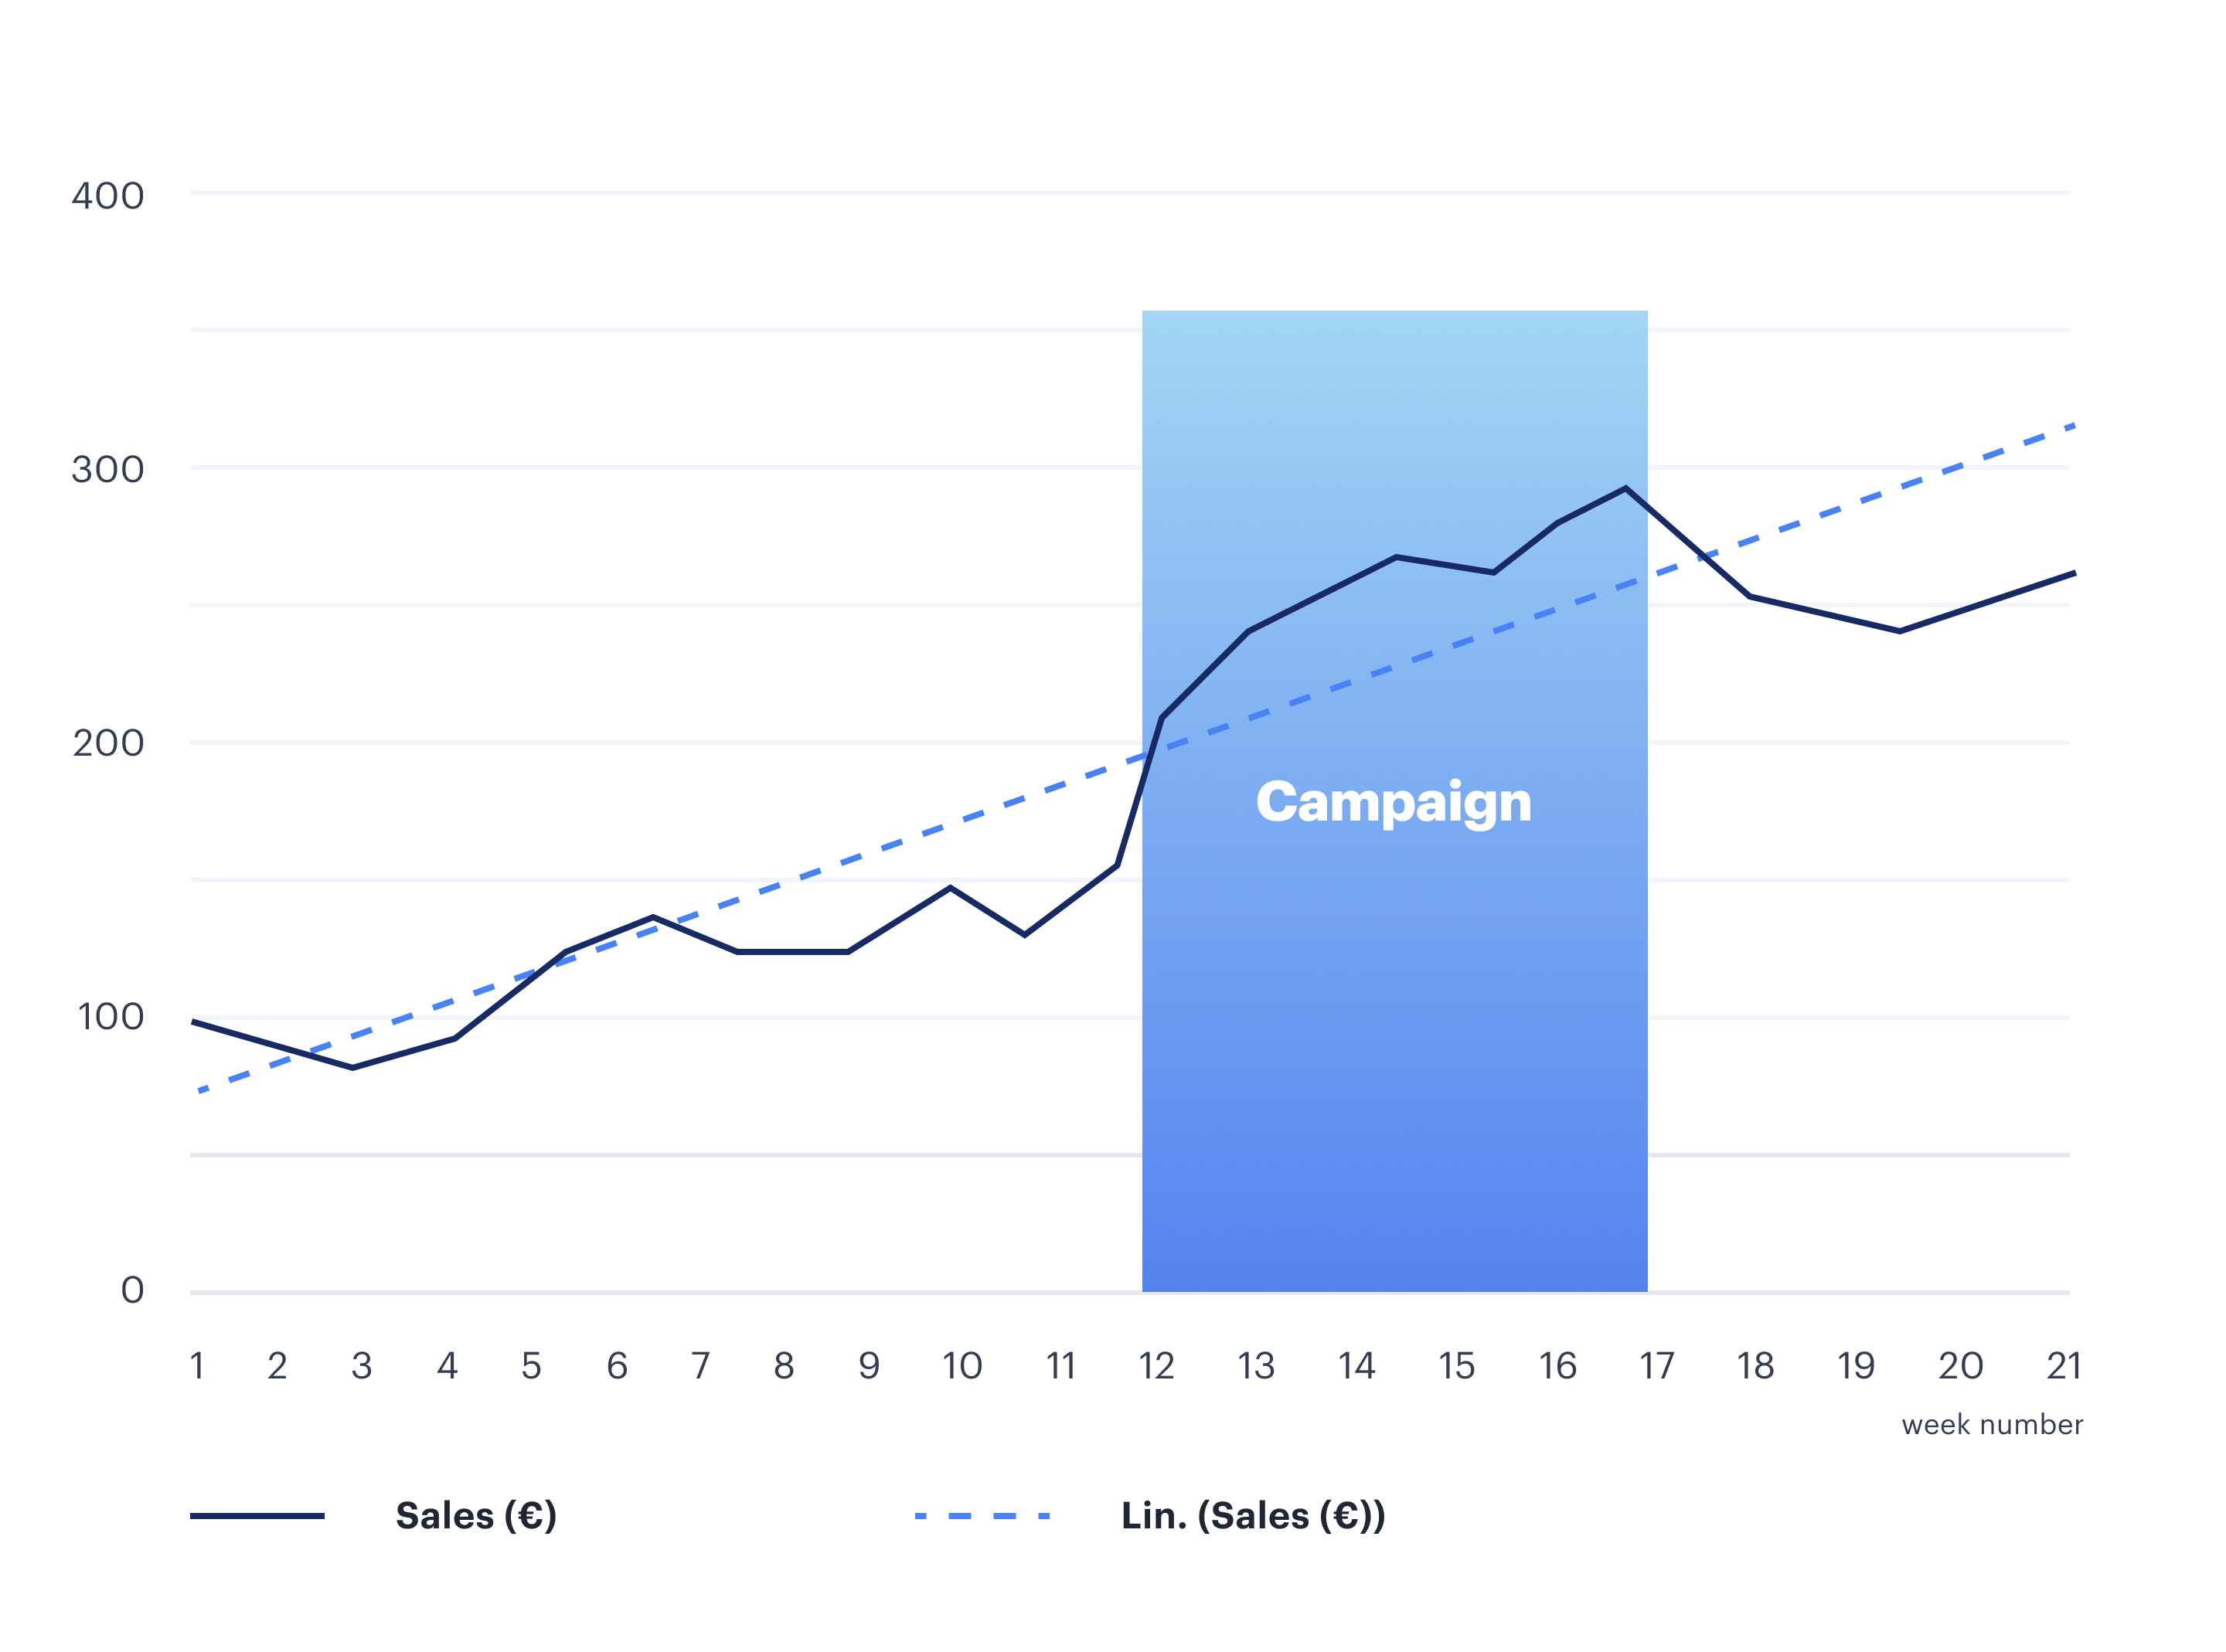
In this case the average weekly sales from the previous period would underestimate the baseline and we would get higher campaign lift than what it actually is. As we want to consider the growing trend to our baseline calculation, we can add the week number to our formula.
.png)
In this formula x week number is the number of the weeks, parameters a (the growth %) and b (the chosen reference point) will be selected so that the baseline values match the sales when there are no active campaigns.
Technical implementation in Excel
The baseline sales are calculated with a formula, that corresponds to the previous equation. We also calculate the squared error for all the weeks without any promotions. The least squares method allows us to create the trend for the baseline sales.
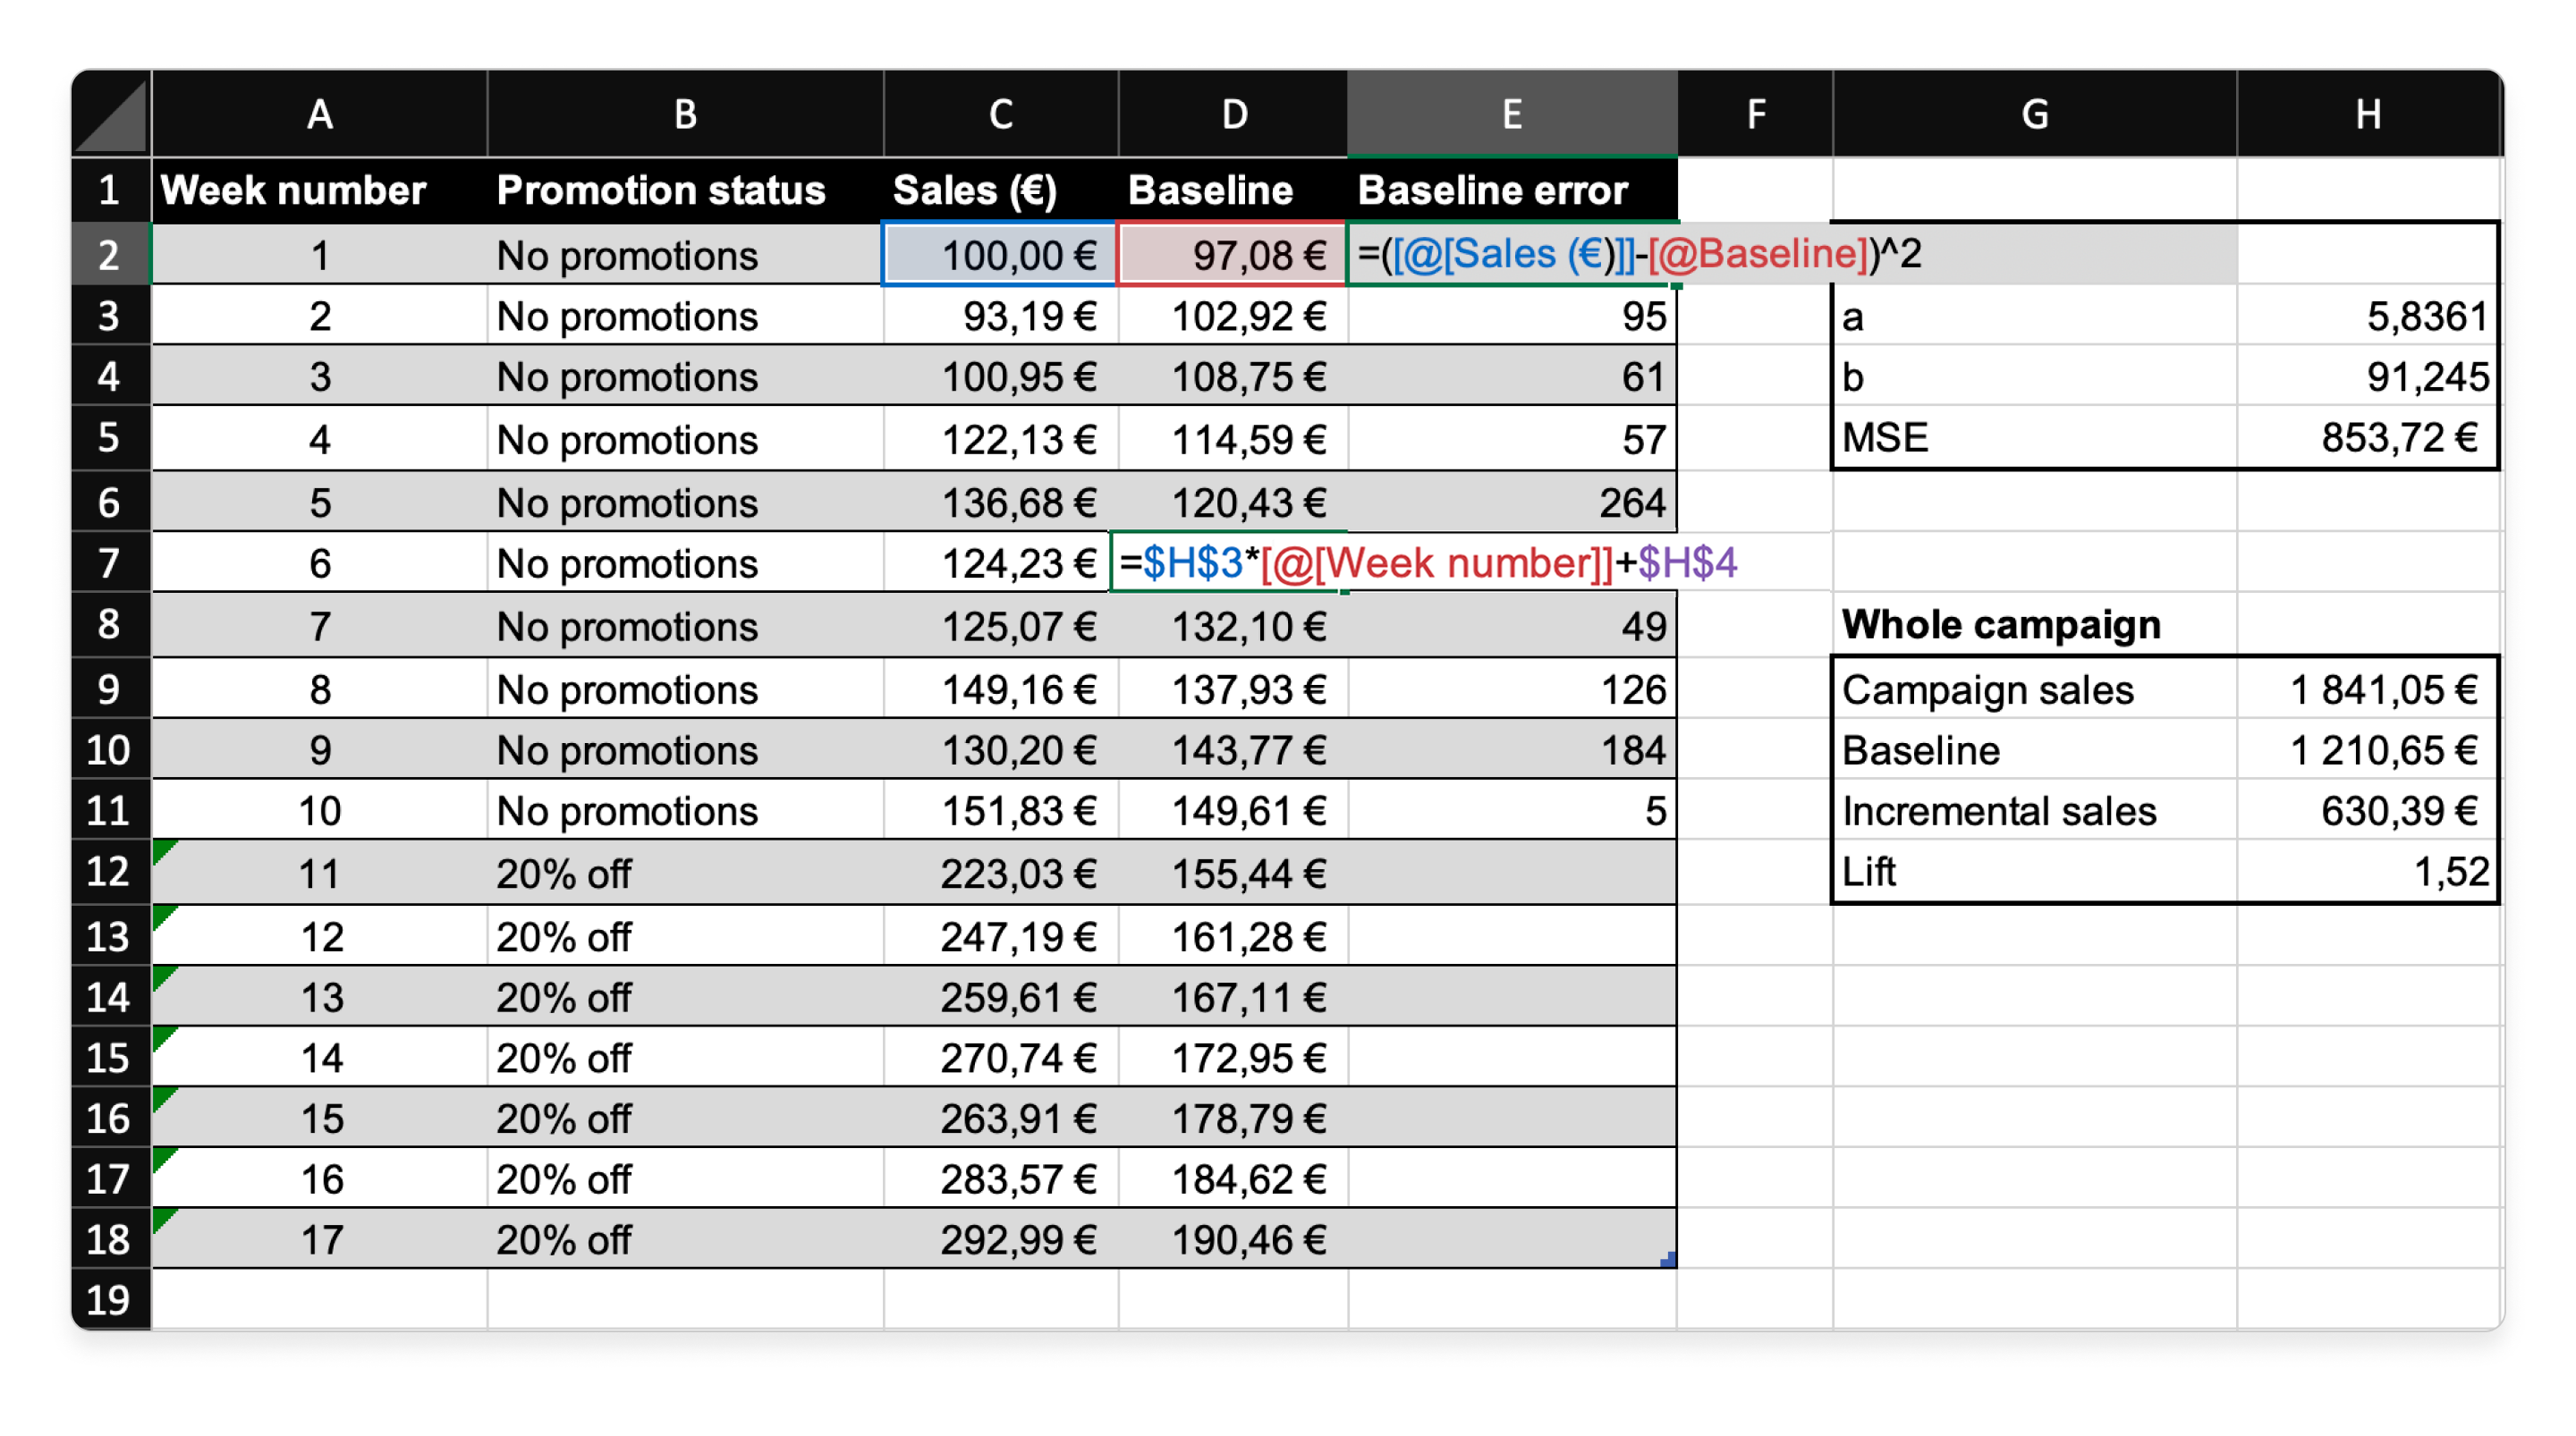
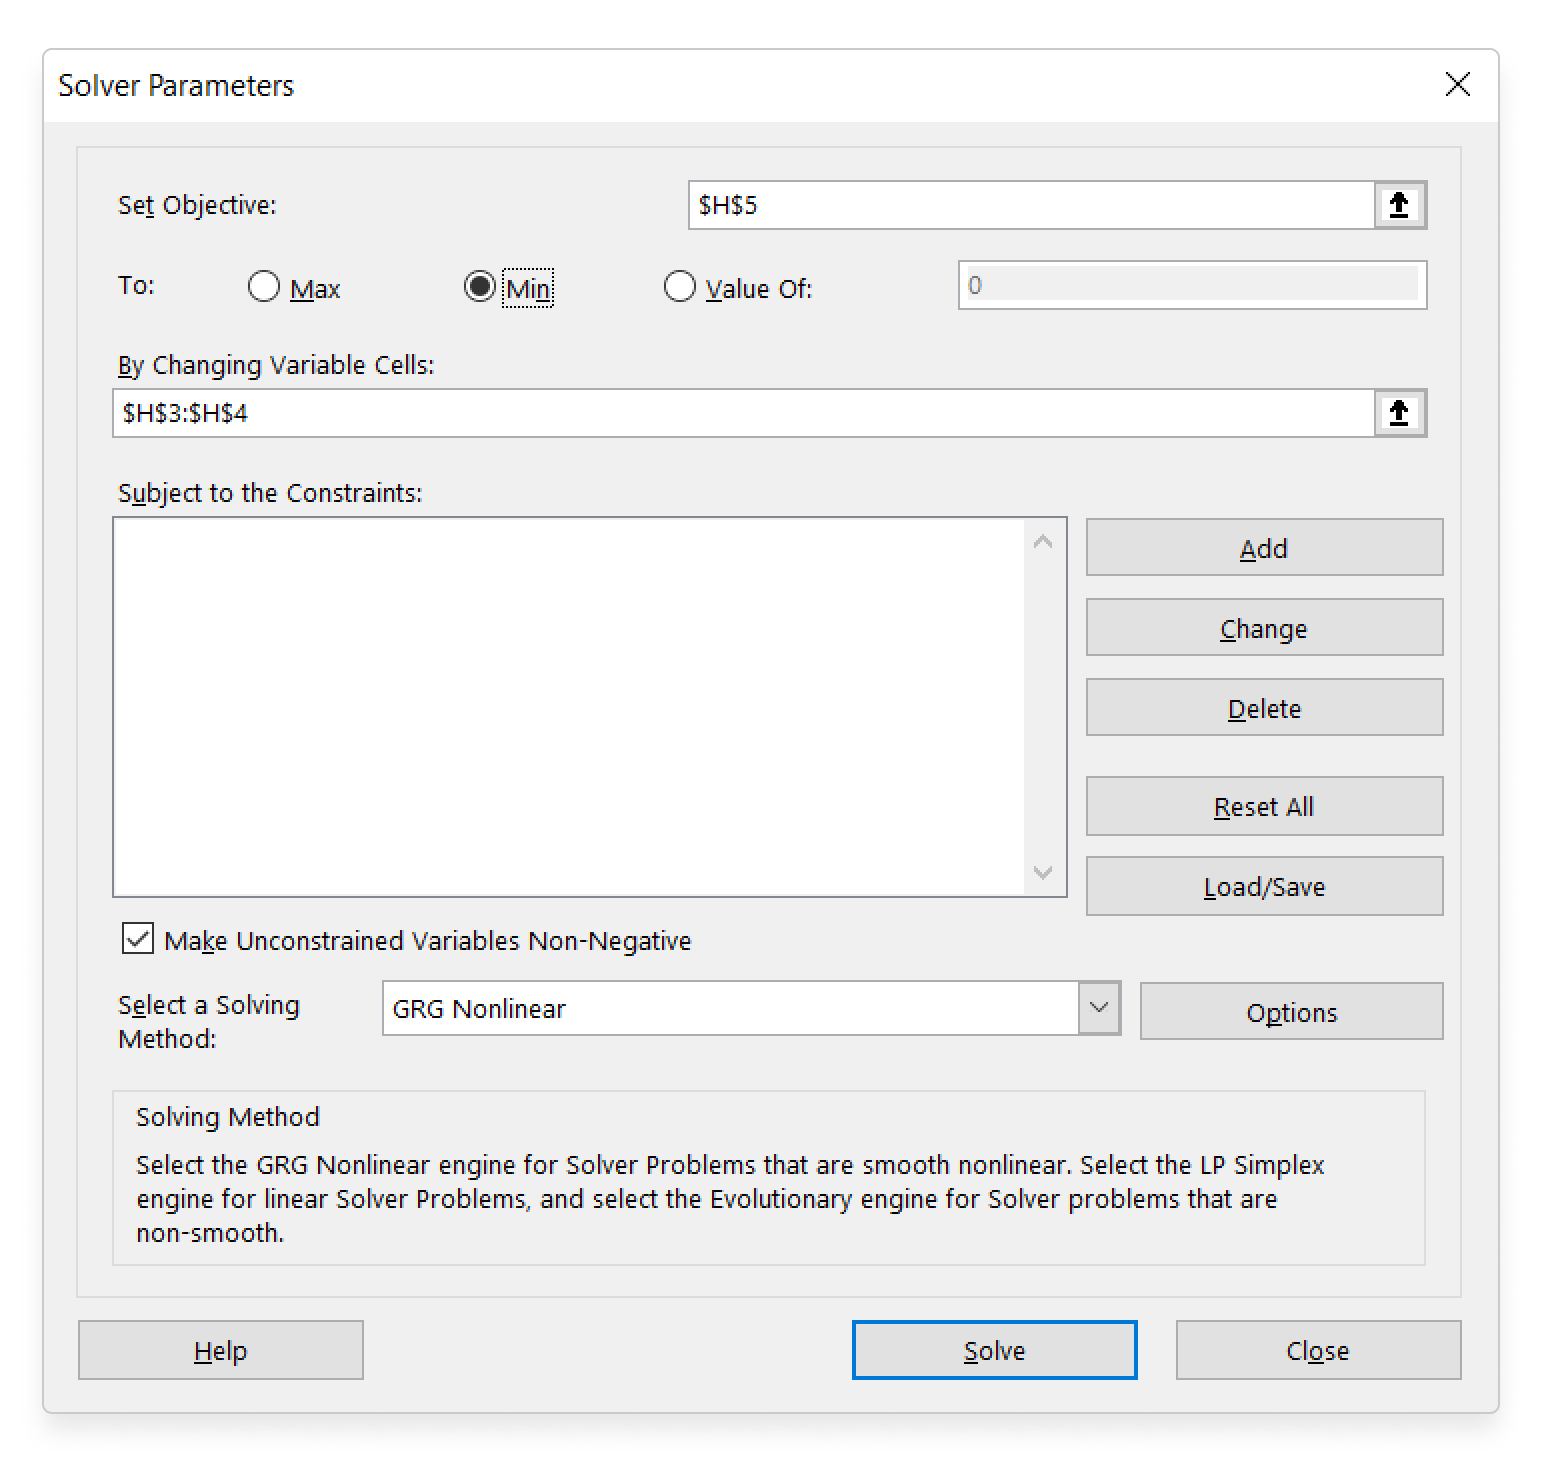
Now that everything is set up, you can use the excel solver to find optimal values for the growth rate (a) and reference point(b). If you have not used the solver before, you need to enable it in Excel. Set the variable cells to match with your chosen values on the spreadsheet. Next you should select MSE as the goal cell and make sure that it is minimized. In this particular case you could choose whichever solver.
Clicking ‘solve’ should provide you the values for a and b and your baseline sales should match the actual sales outside the campaign period. These baseline values can now be used to calculate the campaign lift.
In the beginning we also mentioned seasonality. To consider seasonality for a period of 52 weeks, you could add a feature column with the following formula:

This data should be then included to the baseline calculation:
You could also include other types of data, such as competitor prices, average outside temperatures and make the calculation even more sophisticated.
When to apply?
This approach is already more accurate comparing to the first approach. However, you will need to implement and validate data for each promotion separately, hence applying this method for numerous promotions becomes quickly a full-time job.
The one-month method: Non-linear machine learning
What if we want to take more features into consideration, how could we improve the one-day method even further without overfitting the model? There are many things, which have an impact to the sales in addition to seasonality and trends.
Obviously, the model should perform well also during the campaign period and not only during the regular sales.

Adding multiple years of data will increase accuracy and reliability and in order to train the data you could utilize other products’ data as well. Although this could perhaps be done in Excel, in the long run this would be the point, when you might want to start looking for alternatives and switch to a programming language.
Adding different products to the training data increases the complexity of necessary features. Categorial features, such as product identifiers and store types are likely the first ones you want to add. The relationship between the features and the baseline sales is no longer linear but having more data to back you up will make it possible to use non-linear machine learning models.
Technical implementation using programming language
There are various tree-based machine learning models, like XGBoost and Gaussian Process, but for this kind purpose LightGBM is the most suitable one and is able provide great results.
The following code is a Python example that utilizes a regression model on the previous example’s excel file. Due to limited dataset, it is not possible to use LigthGBM in this case. Instead, we are using linear regression with monthly seasonal variation.

When to apply?
This method requires systematic data collection and a skilled analyst who has the time needed for developing the modeling.
These three approaches all require different amount of work and expertise from the one playing with the data. All of them can exploit different amounts of data and deliver accuracy on three different levels. The following table gives you some guidance on which approach to apply and when. We are also happy to discuss with you, in case you want to hear more about how to achieve the best accuracy and completely automate the baseline calculations. Our solution A² Trade Promotion is created for this.
To summarize

If you want to learn more about those six common pitfalls regarding promotion impact analysis, you can read the blog post here. Also, if you want to get a copy of the file with all the formulas, drop us a line, we'll be happy to share it with you.
How Calculating Baseline Sales Can Determine the Success of Promotions