Distribution and Sales Velocity – Your Commercial Edge
Be proactive and stay ahead of the game
As an account manager, staying proactive and up to date on your portfolio's performance is essential. Regular checks on distribution and ROS give you the confidence to know what needs to be done next and how to prepare for commercial conversations with your customers.
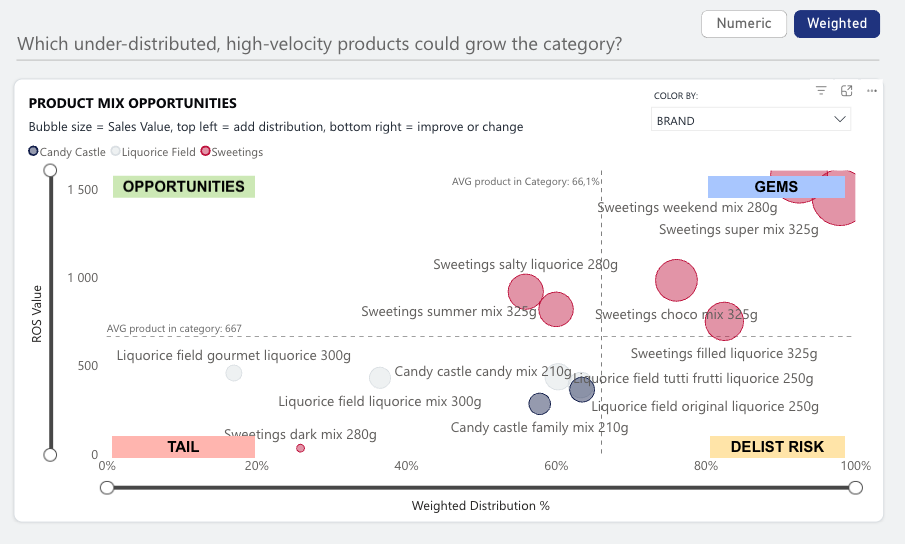
A powerful way to structure portfolio performance is to cluster your products by distribution and rate of sale. These two measures together tell you where to act and how:
- The Gems High ROS, high distribution
- Secure shelf space and monitor competitive pressure
- The Growth Opportunities High ROS, low distribution
- Proven demand already exists, prioritise distribution expansion
- The Underperforming Tail Low ROS, low distribution
- Consider delisting to free up space for stronger performers
- The Risk of Delisting Low ROS, high distribution
- Activate, improve shelf placement, and review price and pack
Use your business knowhow to set the right scope for the analysis. In many cases, the most actionable level is chain and category segment, because this is where range decisions are actually made. Make sure the analysis covers a coherent range: products that compete for the same shelf space belong in the same analysis.
Building a growth story for retailer negotiations
Distribution and sales velocity analysis gives you the tools to show a retailer how category growth can be created together. The strongest opportunities lie in products with high ROS and low distribution. These are the arguments that move range decisions.
- Find growth opportunities within the portfolio
Start with the products that have proven demand but limited reach. A product with high ROS and low distribution is not a risk for the retailer, it is a missed opportunity. - Prepare the cannibalisation argument
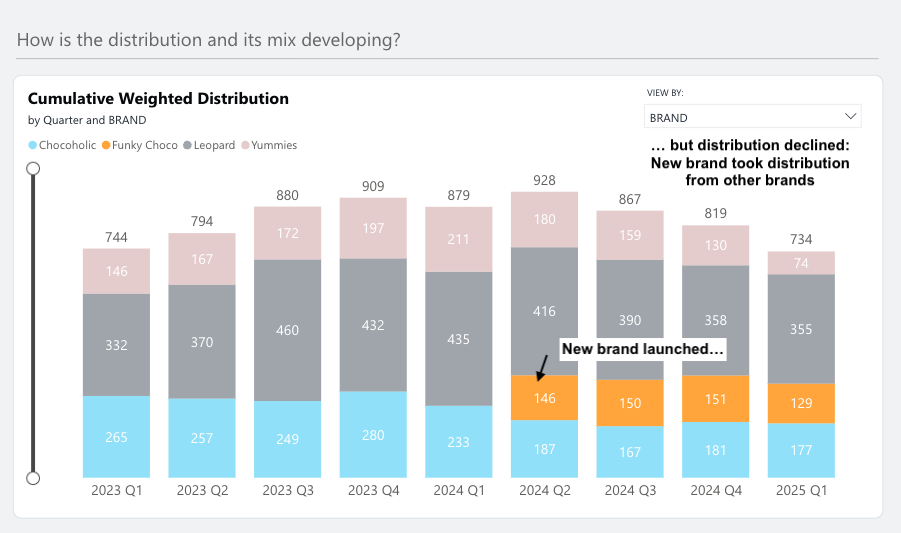
When proposing a new or under-distributed product, the retailer will ask whether it grows the category or simply reshuffles existing sales. Track the trend: show how adding the product to the assortment has maintained or grown the rate of sale across your portfolio in listed stores. - Put a number on the opportunity
Estimates make the argument concrete. You can calculate the incremental sales by calculating the number of stores where the product is not yet listed and multiply by its current ROS. A specific euro figure lands very differently from a general growth argument and gives the retailer something to evaluate, not just consider.
Data and insight alone do not tell the whole story. But combining them with professional judgement and commercial experience is where the real power lies. Numbers show you where to look, experience tells you what to do next. Analyse² BI and AI helps you bring these insights easily into your day-to-day account management, turning analysis into a natural part of how you lead and grow your business.