Analyse² BI and AI
Drive sales and strengthen your market position
Best-in-class analysis tools and AI agents that turn diverse data sources into a clear picture of your market, customers, and sales

Get ahead of competition and grow your categories
Gain unmatched market understanding, uncover what truly drives your sales, and make decisions that put you one step ahead of the competition. Analyse² AI automatically handles the groundwork of analysis on your behalf, while Analyse² BI provides the best traditional analytical tools to dig deeper, verify the critical numbers and build the case for your next decision.
Analyse² BI
Outpace your competition with a unified view of the market, your business, opportunities and threats. With an NPS score of 60, A² BI offers both ready-made dashboards and customizable tools praised for usability and analytical depth across diverse data sources.
- Gain a competitive edge with market insights
- Boost growth with sales driver analysis
- Improve assortments and distribution
- See competitor actions and respond promptly
- Drive sales with shopper insights
- Cover all data from POS to web scraping

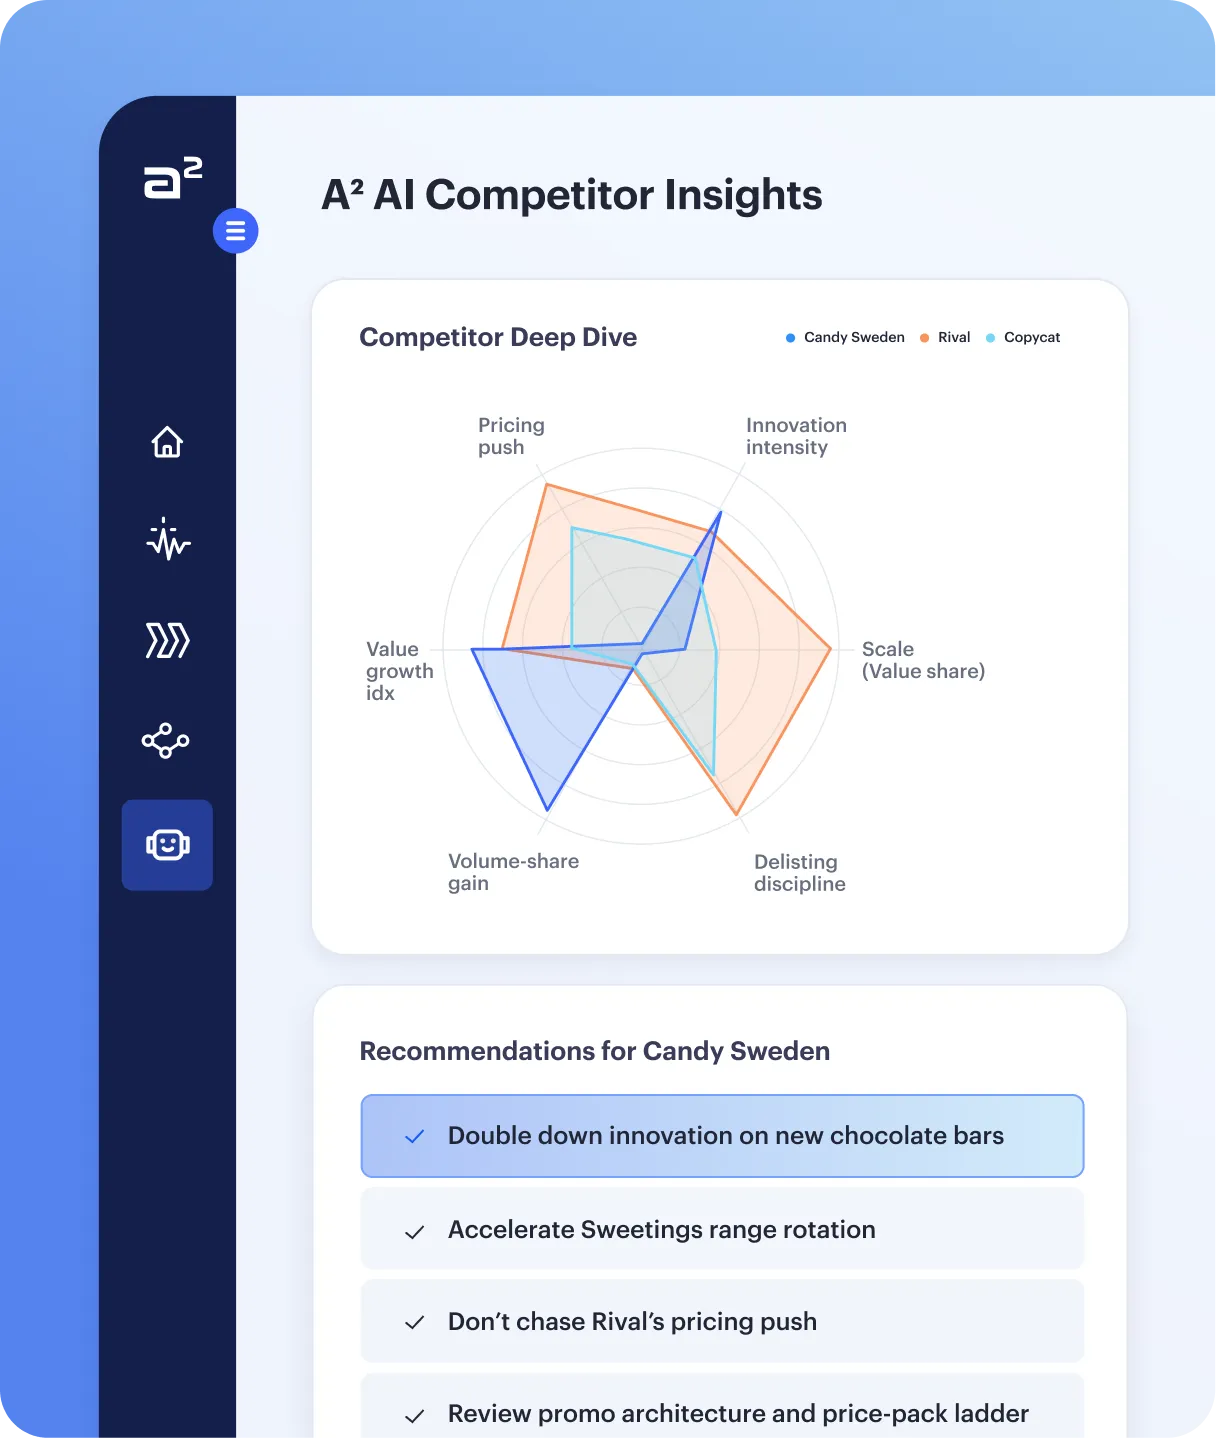
Analyse² AI (early access)
Let AI automate recurring analyses so your team can focus on adding value. Analyse² AI is a team of agents that delivers market, competitor, sales, and category analyses with conclusions, recommended actions, and ready-to-present visuals.
- Run complex analyses overnight
- Receive complete visual reports and slide decks
- React faster with automated insights
- Win and defend with recommended actions
- Dive deeper into any finding in Analyse² BI
- Reach conclusions before competitors get started
How does A² AI support analysis?
We integrate your data
We bring together data from you, your retailer partners, and external sources into a unified model that powers both A² BI and A² AI, giving you a full view of your market.
AI agents carry out the analysis
AI agents run in the background 24/7, retrieving the data they need, surfacing relevant insights, and generating analyses with data visualizations.
Results are ready in the morning
Analyses with conclusions, recommendations, and visualizations are waiting for you in the morning — available both as analysis reports and PowerPoint decks.
You review, refine and act
Review the findings and refine as needed. Ask follow-up questions in the built-in chat, or check the business-critical facts and continue analysis in A² BI.
Examples of what you can do with A² BI + AI
Market Data and Insights
Stay ahead of market and category shifts
Track market share, spot trends, and benchmark against competitors to reinforce your position and thrive in the markets where you operate.
Build stronger categories and brands. Stay on top of category performance, emerging brands, and opportunities to drive growth for your portfolio.
We offer a comprehensive, sales-based view of market realities from total market development to market share of each company, and performance of individual SKUs. In Finland, we can add product information management as a service. We'll tailor a category tree to fit your exact analytical needs, covering every retailer with your preferred product hierarchy.

Sales Analysis
Unlock untapped sales potential
Reveal growth opportunities across customers and channels, and focus your efforts where they'll have the greatest impact. Find ways for sales success while growing your customers' categories.
Improve assortments and coverage. Analyze your customers' chains and channels to understand demand, identifying ways to refine your product mix and expand distribution.
Collaborate more effectively with retailers, turning data to fact-based arguments for better assortment listings and campaigns — driving growth that benefits you, your retailer customers, and consumers alike.
Shopper Insights
Understand shoppers and baskets to drive your sales
See who your shoppers are, how's your performance in different segments, and where you stand against the competition. Link buying behaviour to sales performance and take more targeted actions, whether that means increasing reach, driving usage, or growing basket value.
Track key metrics like penetration, average purchase size, and number of transactions to understand what's fueling your growth — and what's holding it back. Compare your KPIs to the category in general.
Our solutions help you get the most from shopper and transaction data, avoiding the pitfalls that come with the different data formats in the market.


Assortment and Pricing Analysis
Optimize your portfolio for maximum impact
Improve assortments to meet shopper demand, expand your store coverage, and boost your results while growing your retailer partner's category. Identify underperformers, elevate winning SKUs, and build compelling arguments for retailers.
Get your price position right compared to competition, and see how market price shifts and pricing changes — both yours and your competitors' — influence demand, volumes and market shares.
Our assortment and pricing analysis pairs powerful POS analytics with price and assortment data scraped from online sources, giving you a detailed view into competitor actions.
Price and Assortment Tracking
See competitor moves as they happen and act
Continuously monitor how your products and competitors' offerings are priced and positioned across channels to respond promptly to changes, seize the opportunities and minimise negative impacts to performance.
We track price, promotions, and assortment & distribution movements so you can act fast and maintain an edge in the changing markets. Use our POS-based analysis tools together with the tracking data to get the best, up-to-date view into your business, opportunities and the competitive landscape.

How it works
It starts with you choosing what data sources you want us to process for you. We integrate those sources to Analyse² data warehouse to create a single source of the truth. After that, you get access to best-in-class BI solution with dashboards, reports, and customizable analysis tools, elevated to a new level of productivity with AI agents that analyze the data for you.

Helping customers succeed
Please contact our sales for more and more thorough reference cases of leading brands in the Nordics.
“Analyse² is the most functional, advanced and versatile solution for analyzing POS data and increasing market understanding in Finland.”

Anna Vahokoski
Category Development & Trade Marketing Manager,Eckes-Granini Finland Oy Ab
"With Analyse², we took a major leap in more modern and efficient way of working. Our decision-making gained data-driven clarity, speed, and transparency."
Mika Salmi
Senior Key Account Manager Findus Finland Oy

Request a demo
See how our solutions can improve your business
Join leading FMCG companies across the Nordics already using Analyse² to drive profitable growth and make data-driven decisions.